Chapter 4. Using the model
This chapter demonstrates the use of the model by means of three examples. The first focuses on the effect of education on demographic behaviors as well as future size and educational composition of the population. We compare different educational scenarios, with the principal scenario based on past trends, and alternative scenarios that introduce universal primary education immediately or phase it in over a decade. The second example focuses on child mortality and demonstrates how micro-simulation can disassemble effects—the reduction of child mortality due to educational expansion—into their driving factors: higher education of mothers, avoidance of early teenage pregnancies due to later union formation, and a general reduction in the number of births. The third example studies the influence of education on internal migration and the future educational composition and population size of the capital, Nouakchott, compared to the rest of the country.
4.1. Analysis Example: Demographic Effects of Education
4.1.1. Scenarios
The starting point of this analysis is a base population projection scenario, similar to national projections provided by the Mauritanian National Statistical Office. The differences involve:
- Internal migration, which is not modeled by ONS. As will be shown later, internal migration is very sensitive to assumptions about the impact of education on migration. The base scenario used here does not include education in the modeling of migration and keeps internal migration patterns by age, sex, province of residence, and destination constant over time. Like ONS, we do not model international migration in the base scenario. When adding international migration to the model, assuming constant emigration rates by age and sex and a one percent increase in immigration over time (excluding recent refugee immigration), the population would increase faster, as shown in the comparison of three scenarios that follows.
- Fertility is modeled by education, union status, province, and parity and applies recent time trends by birth order. Interestingly, we achieved almost identical numbers of births as in the macro model and thus do not use the alignment options provided by the model. Unlike the macro model, we included fertility for ages under 15. Unlike the macro scenario, fertility changes when education assumptions are changed. Education affects fertility both directly (more highly educated women have lower fertility) and indirectly, via changes in union formation age (more highly educated women have a higher average age at first marriage).
- While we use the same age-specific mortality rates as in the macro projection, we “activated” the child mortality module, which applies relative risks to child mortality (at ages 0-4) by mother’s education and age. While the child mortality model is calibrated to the overall age-specific mortality rates at the beginning of the simulation and applies the same overall improvements in mortality rates as in the macro model, the changing education composition of mothers leads to a faster decline in mortality rates than in the macro model. Child mortality issues are discussed in more detail in the next chapter.
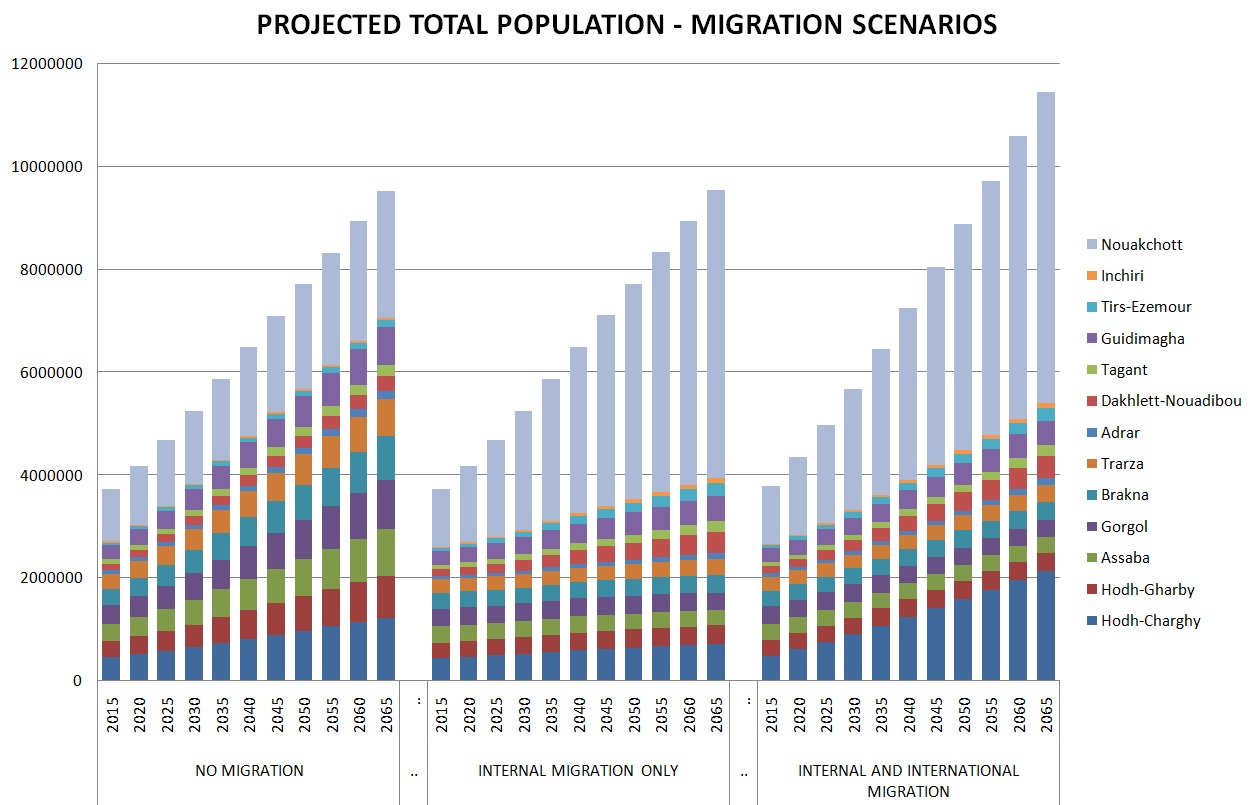
Figure 4-1: Population by Province and Migration Scenario
In Figure 4-2, we use the “internal migration only” scenario as the base scenario.
For education, the base scenario uses the model discussed in detail in Chapter 3, section 3.3. The model is based on past trends of entry and graduation probabilities in primary education. They are modeled by sex, year of birth, and province of birth, assuming constant relative differences between provinces (expressed in odds ratios) as observed in the past. Provincial differences are very pronounced: in Nouakchott, 60 percent of 15-year-olds have graduated primary school, while in the second largest province, Hodh Charghy, this number is only 20 percent.
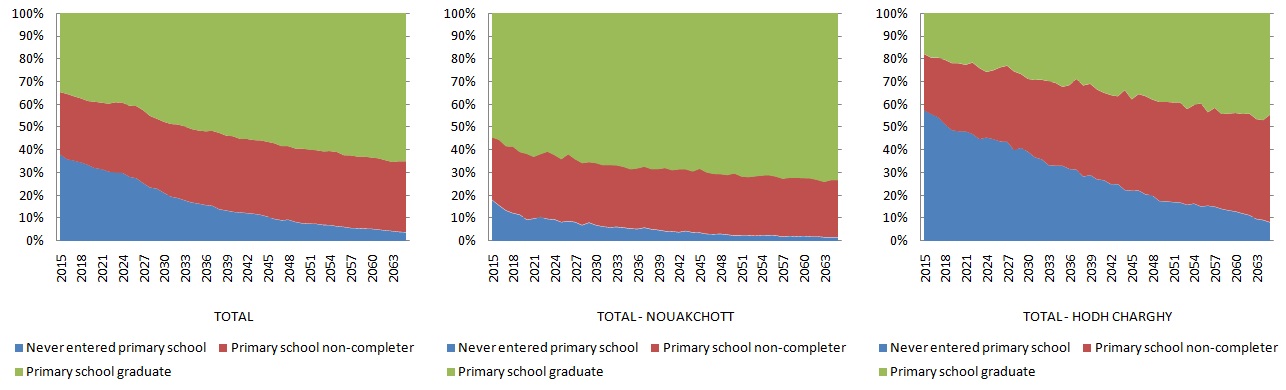
Figure 4-2: Primary Education of 15-year-old. National and Provincial Examples. (Simulation Results)
In an alternative scenario of universal primary education, we assume universal primary education is effective for all children born during and after 2010. For some analysis, we also add a scenario of phased-in universal primary education, where universal primary education is reached linearly over a period of 10 years, starting with the 2010 birth cohort.
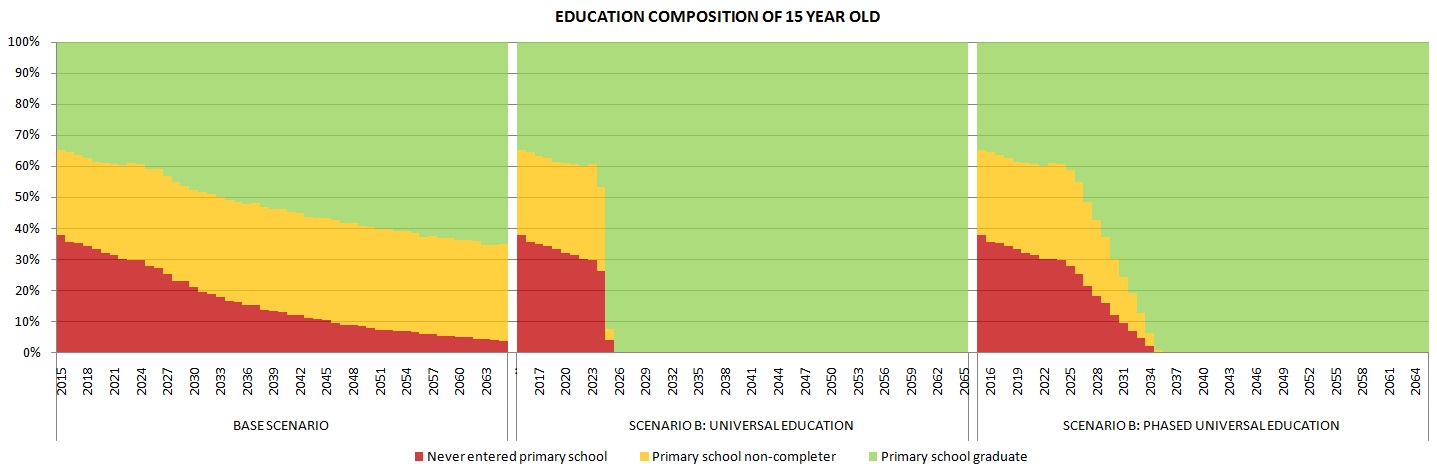
Figure 4-3: Primary Education of 15-year-old. Alternative Scenarios. (Simulation Results)
4.1.2. Results
As the current young and future cohorts affected by educational improvements replace the overall population over time, the educational composition of the total population also changes. The speed of change depends on the size and speed of the educational improvements, and is fastest in the “universal primary education scenario.” The following three graphs show how the educational expansion changes the education composition of the population age 15 through 59. Given the current very high educational differences between provinces, both the starting point and speed of improvements are very different on a regional level. In the figures, we contrast the capital, Nouakchott, with the rest of Mauritania. Note that the provincial educational distributions also result from internal migration. The impact of education on migration and the resulting educational compositions of populations by province will be discussed in detail in Chapter 4, section 4.3.
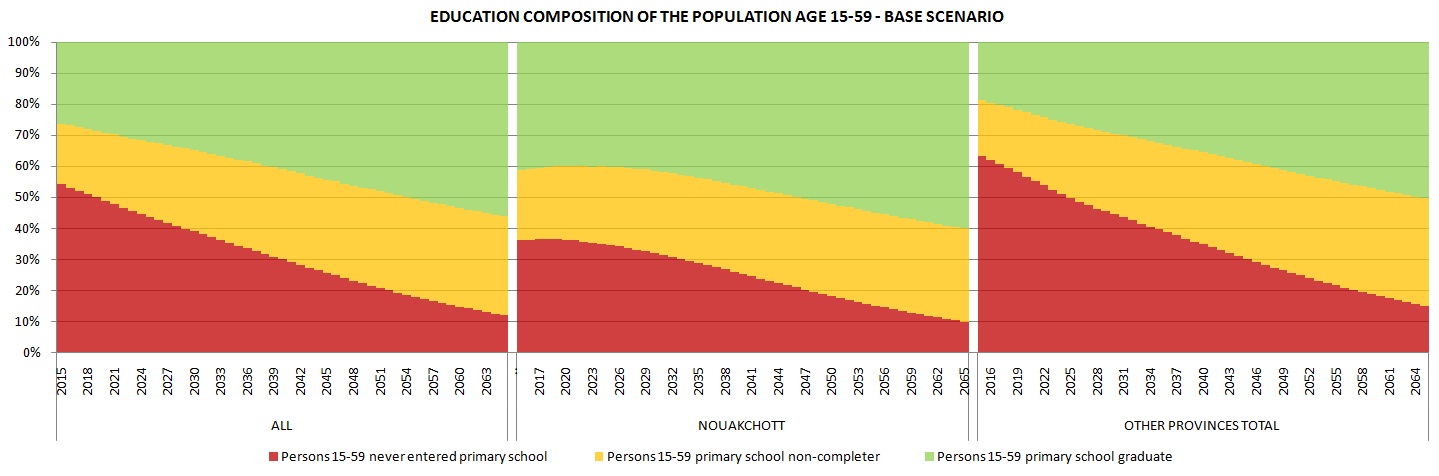
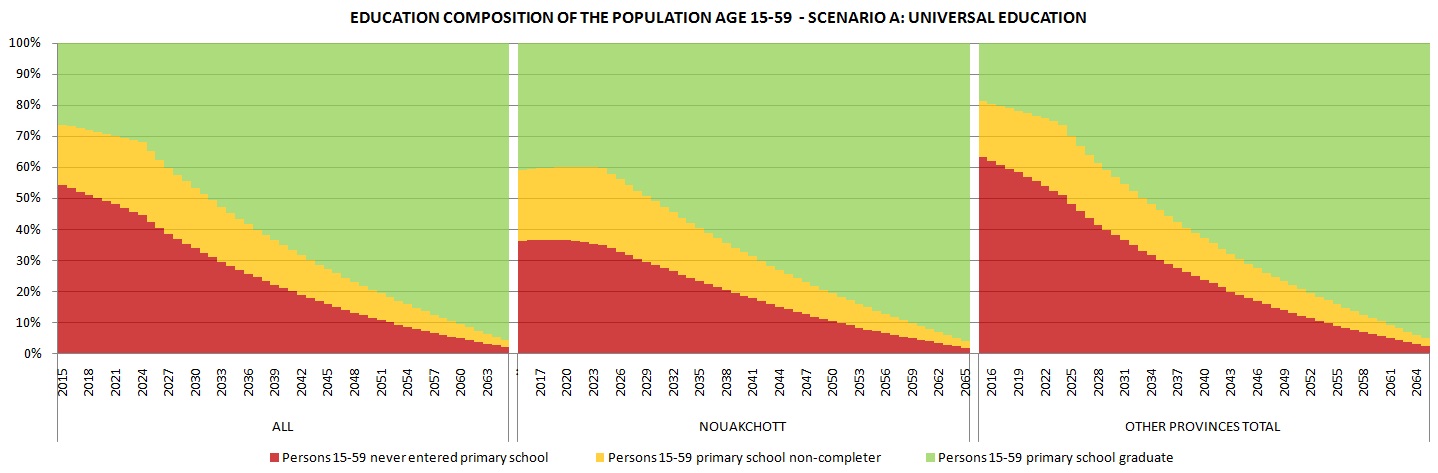
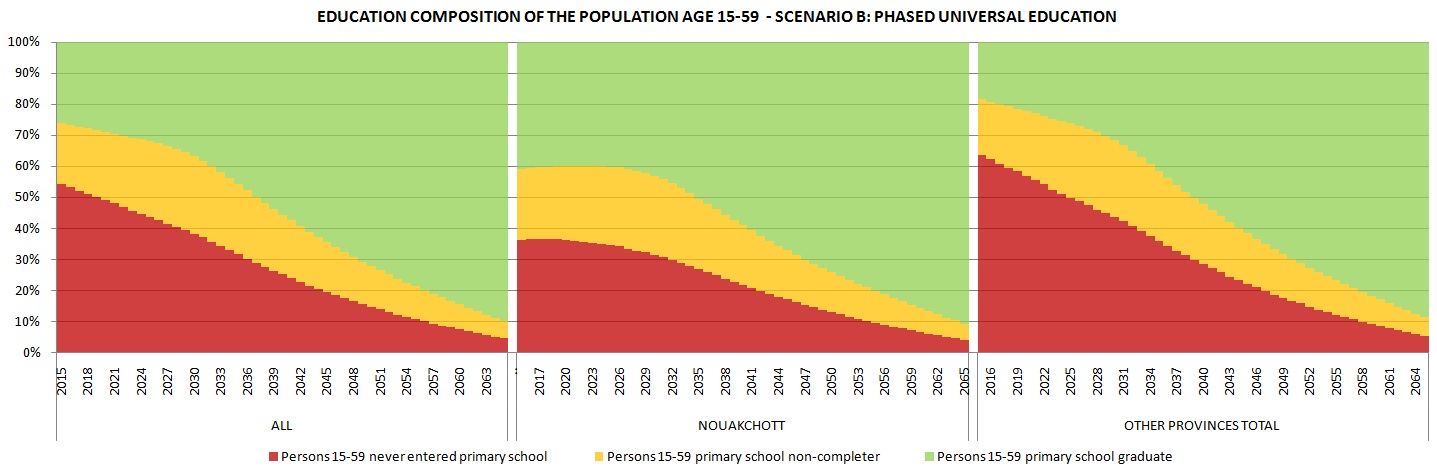
Figure 4-4: Projected Educational Composition of the Population Age 15-49 in Three Scenarios
Improvements in education impact not only the educational composition of the population, but also the future size as more highly educated women, on average, give birth later and have fewer children.
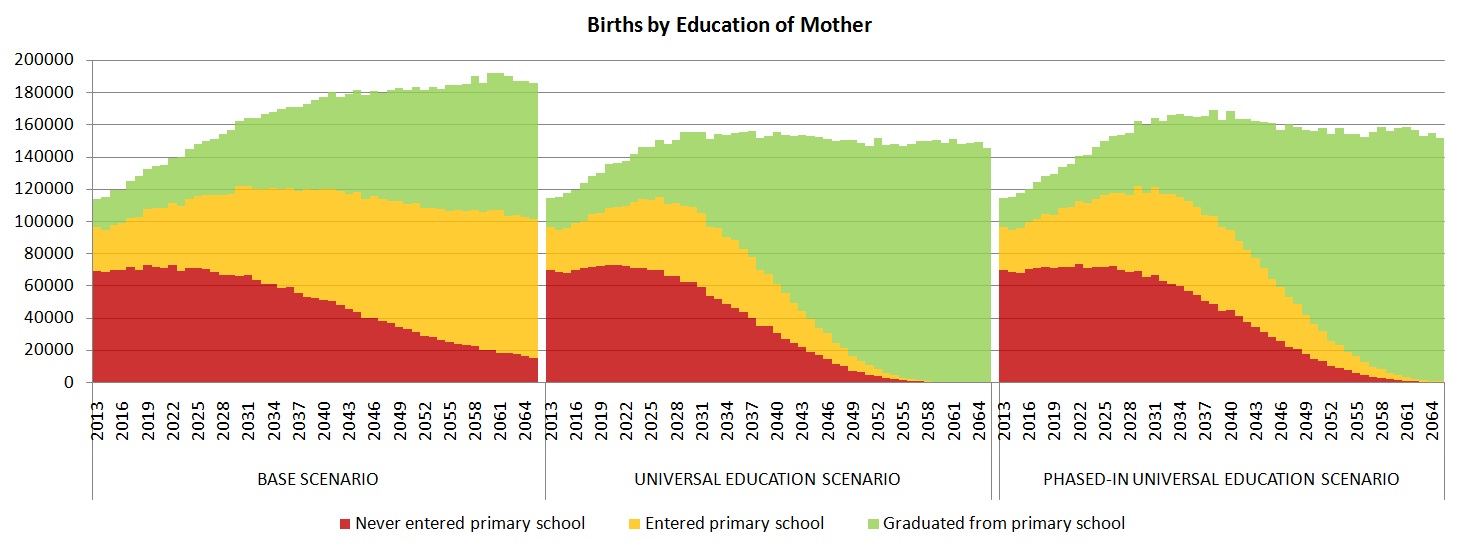
Figure: Projected births in three scenarios
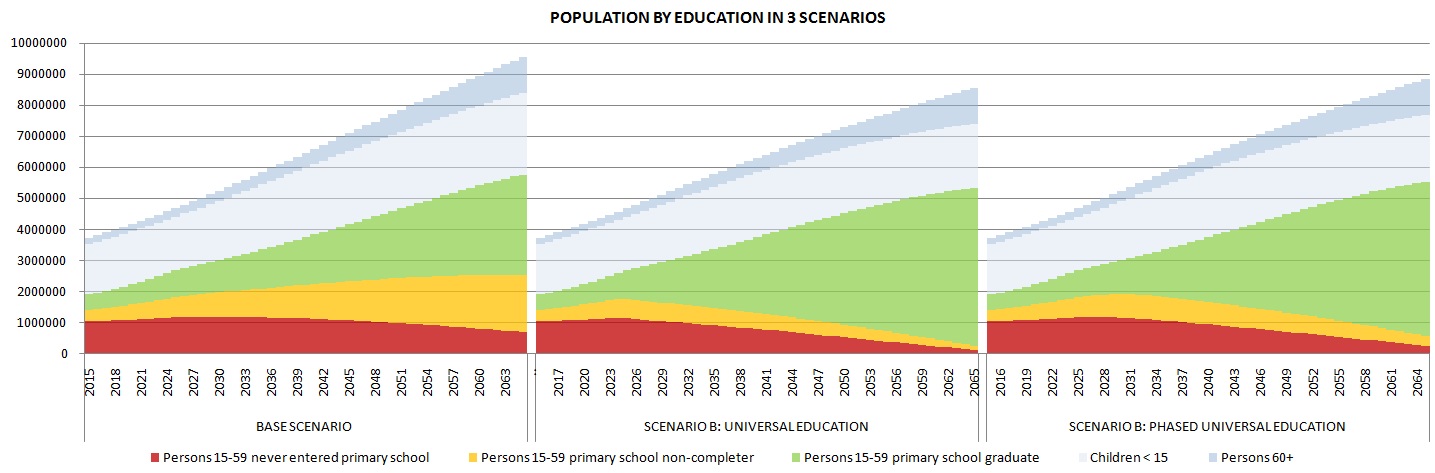
Figure 4-5: Projected Total Population in Three Scenarios
Fewer births also result in fewer deaths. Education’s impacts on mortality, and specifically the impact of mother’s education on child mortality, are detailed in Chapter 5. In this chapter, we discuss the various demographic impacts of education, comparing base to universal primary education scenarios.
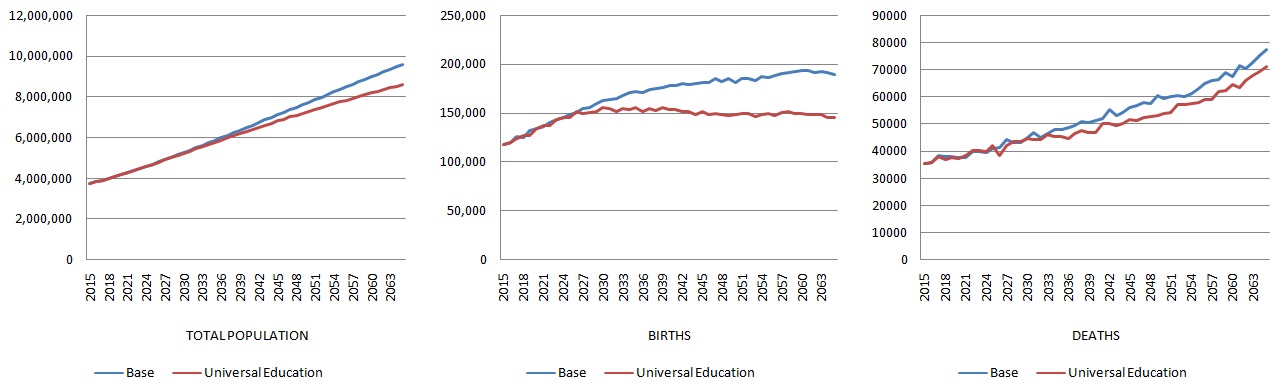
Figure 4-6: Total Population, Births, and Deaths in Two Education Scenarios
The most striking result of the universal education scenario is the flattening of the total number of births, plateauing at a level of 150,000 births per year. As shown in Figure 4-7, this has a pronounced impact on the future age composition of the population (the age pyramid).
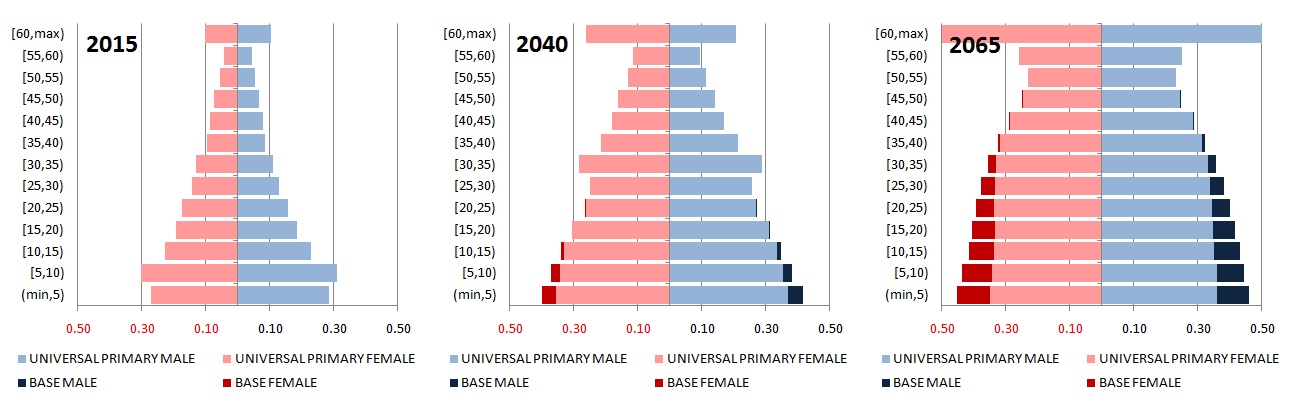
Figure 4-7: Age Pyramids 2015, 2040, 2065 in Two Education Scenarios
An immediate effect of universal education is the reduction in the number of early teenage pregnancies when the first cohorts of females with universal primary education reach reproductive age. Births by mothers under age 17 drop to less than half, compared to the base scenario. Given the effects of low levels of education and youth on child mortality, we also project a drop in infant and child deaths. Another effect of educational improvement is an increase in the average age for first marriages.
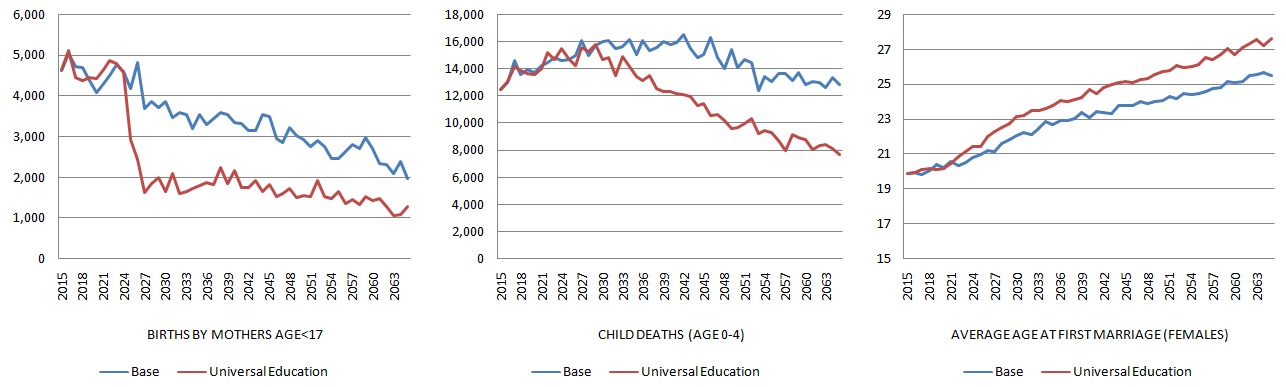
Figure 4-8: Number of Early Teenage Births, Child Deaths, and Average Age at First Marriage
4.2. Analysis Example: De-Composing Changes in Child Mortality
4.2.1. Scenarios
In this analysis, we contrast two main scenarios:
- The base scenario models educational improvements based on past trends, and is the same education scenario described in Chapter 3, section 3.3. and Chapter 4, section 4.1.. To better understand mortality effects stemming from educational change rather than overall improvements in mortality rates, we use a status quo model in mortality with no time trends. While we apply relative risks by age and education of mothers, there is no trend in the baseline rate, which is calibrated to produce the same current overall mortality as the macro model. Over time, the composition of mothers by age and education changes and overall mortality will also improve in the base scenario. This improvement stems entirely from composition effects, i.e., the improved education of mothers.
- The alternative scenario of universal primary education assumes that all children born in and after 2010 enter and complete primary education. This is the only difference compared to the base scenario.
To calculate the individual contributions of changes in single processes to the overall changes in mortality outcome, we ran additional scenarios in which the relative risks by mothers’ education and/or mothers’ age are removed.
At the beginning of the simulation, the overall mortality is calibrated to the assumptions of the macro model used by the Mauritanian ONS. The calibration is performed automatically by the micro-simulation model if the related option is activated:
- ~ 0.075 at age 0 (averaging male and female mortality)
- ~ 0.012 at ages 1-4 (averaging male and female mortality)
The key settings are visible in the following screen-shot of parameters:
- We chose the initial calibration of mortality with application of specific child mortality trends instead of the overall trends calculated from life expectancy parameters.
- We set the trend parameters to 1 over all calendar years, thus not assuming any overall calendar time trend.
- The relative risks are left unchanged from the model described in Chapter 3, section 3.3.
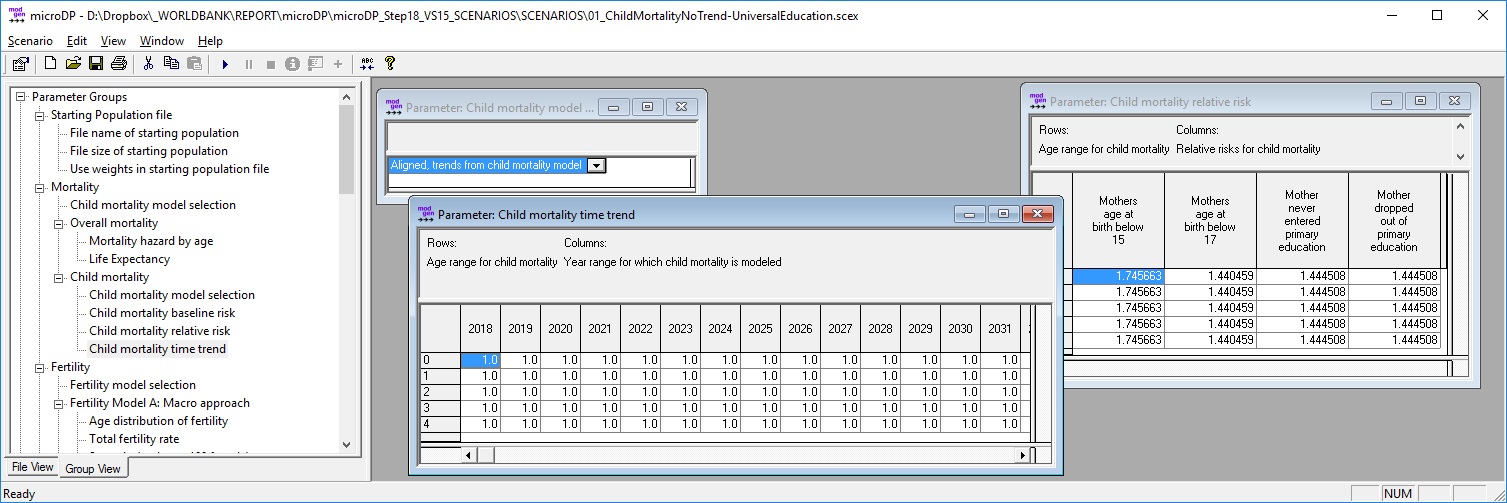
Figure 4-9: Key Parameters for Child Mortality Assumptions
4.2.2. Results
As education improves in both scenarios, overall mortality drops over time. This improvement is, of course, higher in the alternative scenario, which immediately makes primary education universal. Most of the improvement in mortality rates can be attributed to the higher education of mothers, rather than the decrease in early teenage pregnancies. This can be demonstrated by running an additional scenario with no relative risk by mother’s age. The result is intuitive, as the child mortality improvement in more highly educated mothers applies to the whole lifespan of women respectively. and all the children they have, and not to children born in early teenage years, which become very rare due to the improvement in education.
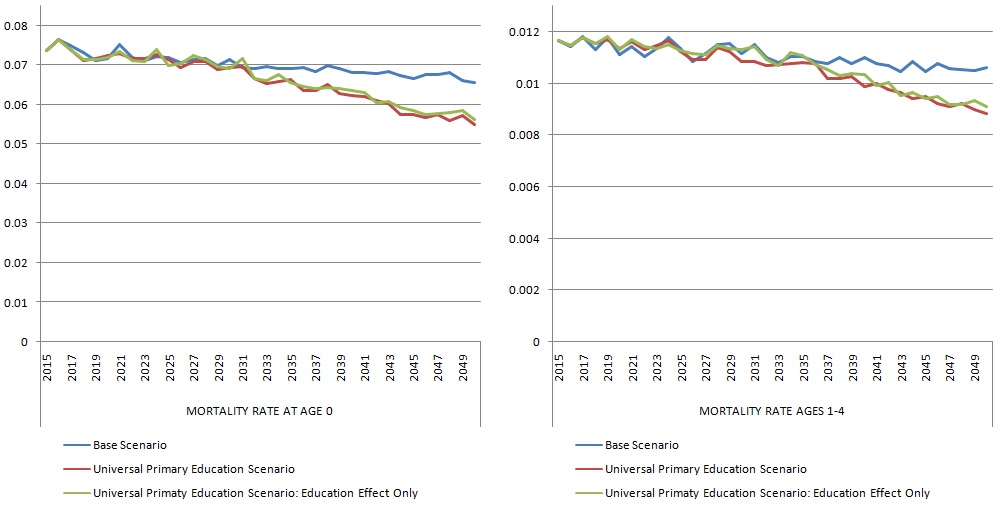
Figure 4-10: Reduction of Infant and Child Mortality Rates Due to Introduction of Universal Primary Education
When looking at numbers of child deaths instead of rates, an additional effect stems from the lower number of births as more highly educated women, on average, give birth later in life and have fewer children. Figure 4-11 compares the number of deaths between the two education scenarios for three calendar year periods. As expected, the effect increases over time as more highly educated cohorts of women replace the population in the fertile age range. In an additional step—by creating and comparing scenarios in which we remove single relative risks—we can separate the decrease in child deaths into their main causes: the higher education of mothers, which is the greatest factor; the avoidance of early teenage pregnancies, which has the least effect; and the overall reduction in the number of births, which is responsible for about one-third of the total reduction in child deaths.
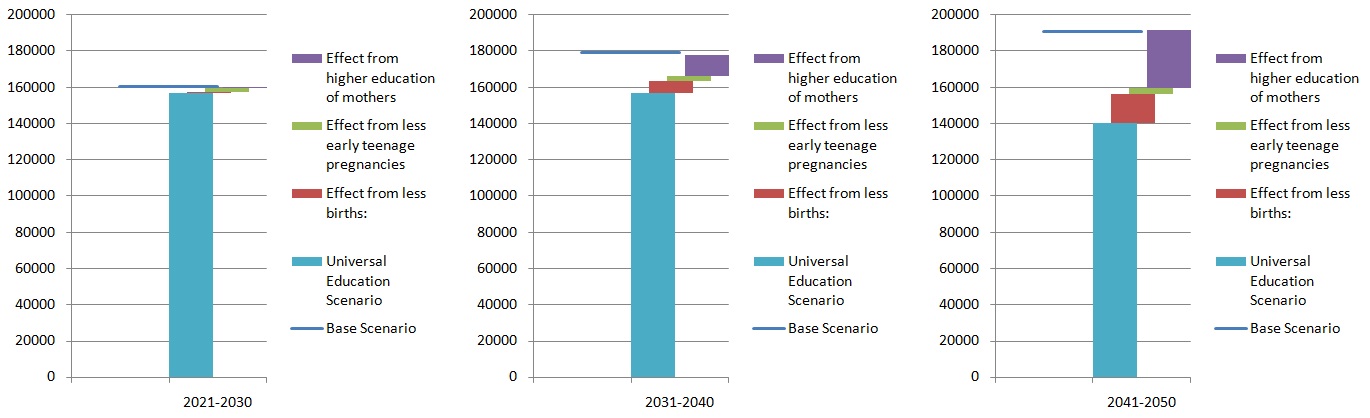
Figure 4-11: Decomposition of the Reduction of the Number of Child Deaths at Ages 0-4 Due to Universal Primary Education
4.3. Analysis Example: Internal Migration by Education
In this example, we focus on the sub-national level of simulation results. From a provincial perspective, the future size and age composition of the population depends heavily on internal migration. Given the inter-provincial differences in educational attainments, internal migration also impacts the education composition of the population within provinces. For example, in the Mauritanian case, we observe high numbers of migration to the capital, Nouakchott, which has comparable high school attendance rates. The way in which migration from provinces—which, on average, have lower education—affects the educational composition Nouakchott’s population will depend on the extent to which educational attainment affects migration probabilities. Is it those with greater or less education who migrate? In this analysis, we compare the size and educational compositions of the population of Nouakchott to that of the rest of the country.
4.3.1. Scenarios
For this analysis, we compare five scenarios. The first, A0, is a scenario without internal migration. Two scenarios, which involve internal migration modeled by age and sex under two alternative assumptions on educational expansion, are based on scenarios introduced in the previous chapters. In the two remaining scenarios internal migration is modeled by age, sex, and education.
- To be able to assess the overall impact of internal migration, we created a Scenario A0 without internal migration. For education, we continued educational trends as observed in the provinces.
- For Scenario A, we combine the base model option of migration with the base assumptions on education, which continues educational trends as observed in the provinces.
- In Scenario B, we combine the base model option of migration with a scenario of universal primary education for all birth cohorts since 2010.
- For Scenario C, we select the refined migration model, which also accounts for educational differences in migration rates. The education scenario here is the base trend scenario.
- Scenario D combines the refined migration model with the assumption of universal primary education.
As discussed in Chapter 3, section 3.6, analysis shows higher rates of migration for more highly educated people, with different magnitudes of effects by province. It must be noted, however, that the projections assume that these current observations also hold for the future. While such assumptions are useful for studying the sensitivity of migration to educational assumptions, they ignore causal mechanisms of migration, such as availability of educational institutions or differences in job opportunities by education. These factors, like many others affecting migration, may change in the future. Micro-simulation is not limited to such simple assumptions, but can provide a powerful tool for the detailed simulation of migration decisions both on the individual and family level. Such models can include contextual information on regions (e.g., public infrastructure, such as the availability of schools) or regional events, such as droughts and climate change. From that perspective, the models can be starting points for more detailed and policy-relevant modeling.
4.3.2. Results
Zero Migration Scenario A0
In the absence of migration, population grows over-proportionally fast outside Nouakchott. Nouakchott distinguishes itself with a substantially higher proportion of primary school graduates, which is one of the factors leading to lower birth rates. Starting with the lower ages, this alters the shape of the age distribution from a typical age pyramid to a “column.” In 2065, cohort sizes of 0 to 25 years old are very similar. In contrast, the rest of the country keeps its current education shape, driven by high fertility.
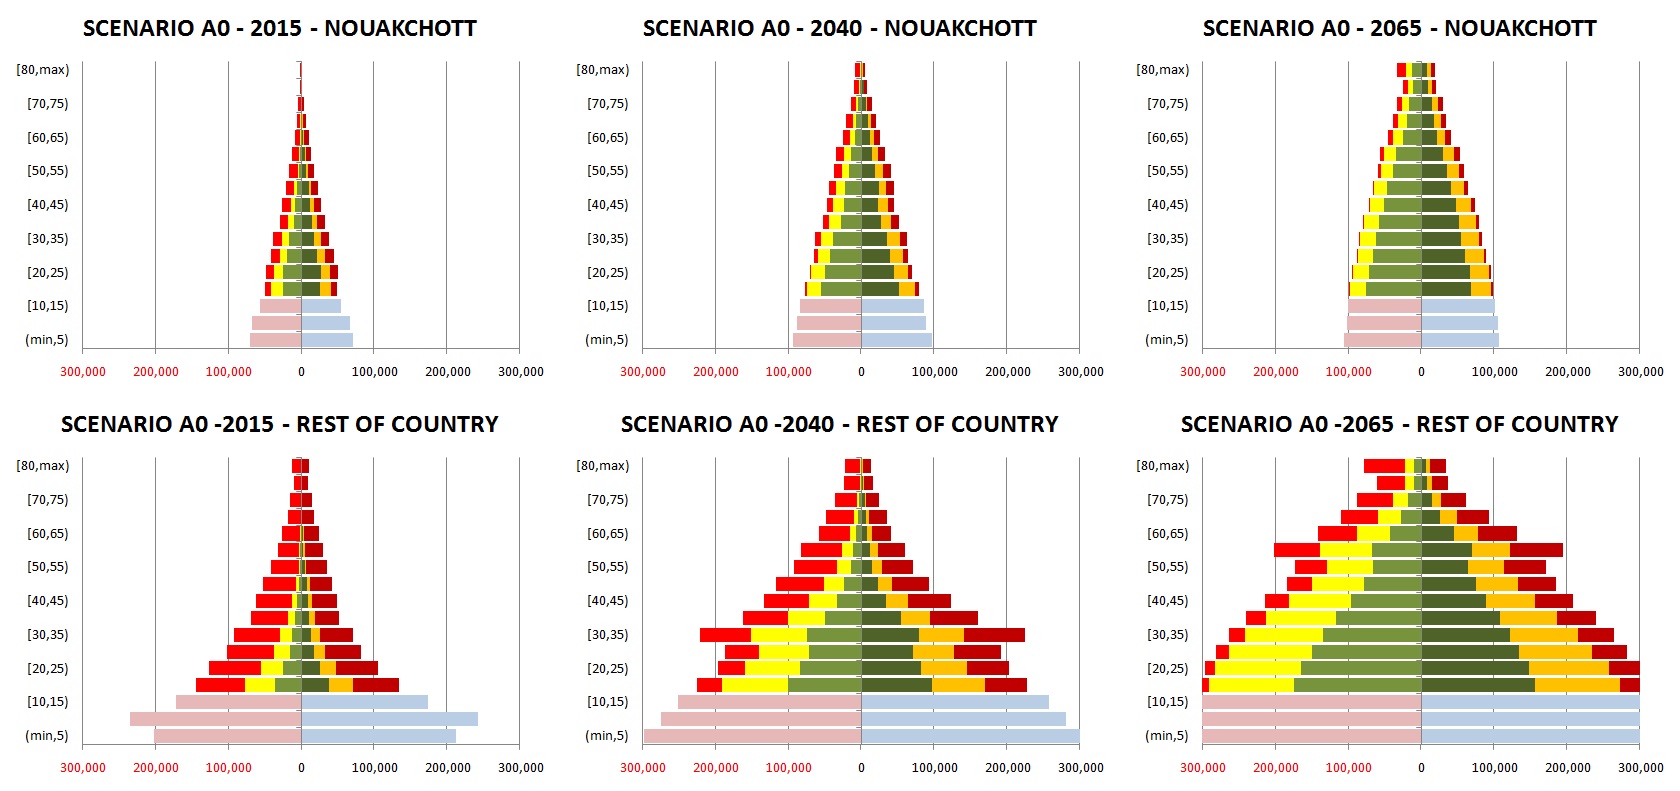
Figure 4-12: Projected Population in Scenario A0. Legend: left female, right male; green: primary graduates, orange/yellow: primary dropouts, red: never entered primary.
The Base Scenario A: Continuing Educational Trends, Base Migration (Without Education)
When internal migration is added to the projection, results are very different: Nouakchott now grows over-proportionally fast and part of its comparably favorable educational composition is lost due to the proportionally lower education of in-migrants. At around 2040, Nouakchott reaches the same population size as the rest of the country with very similar age distribution.
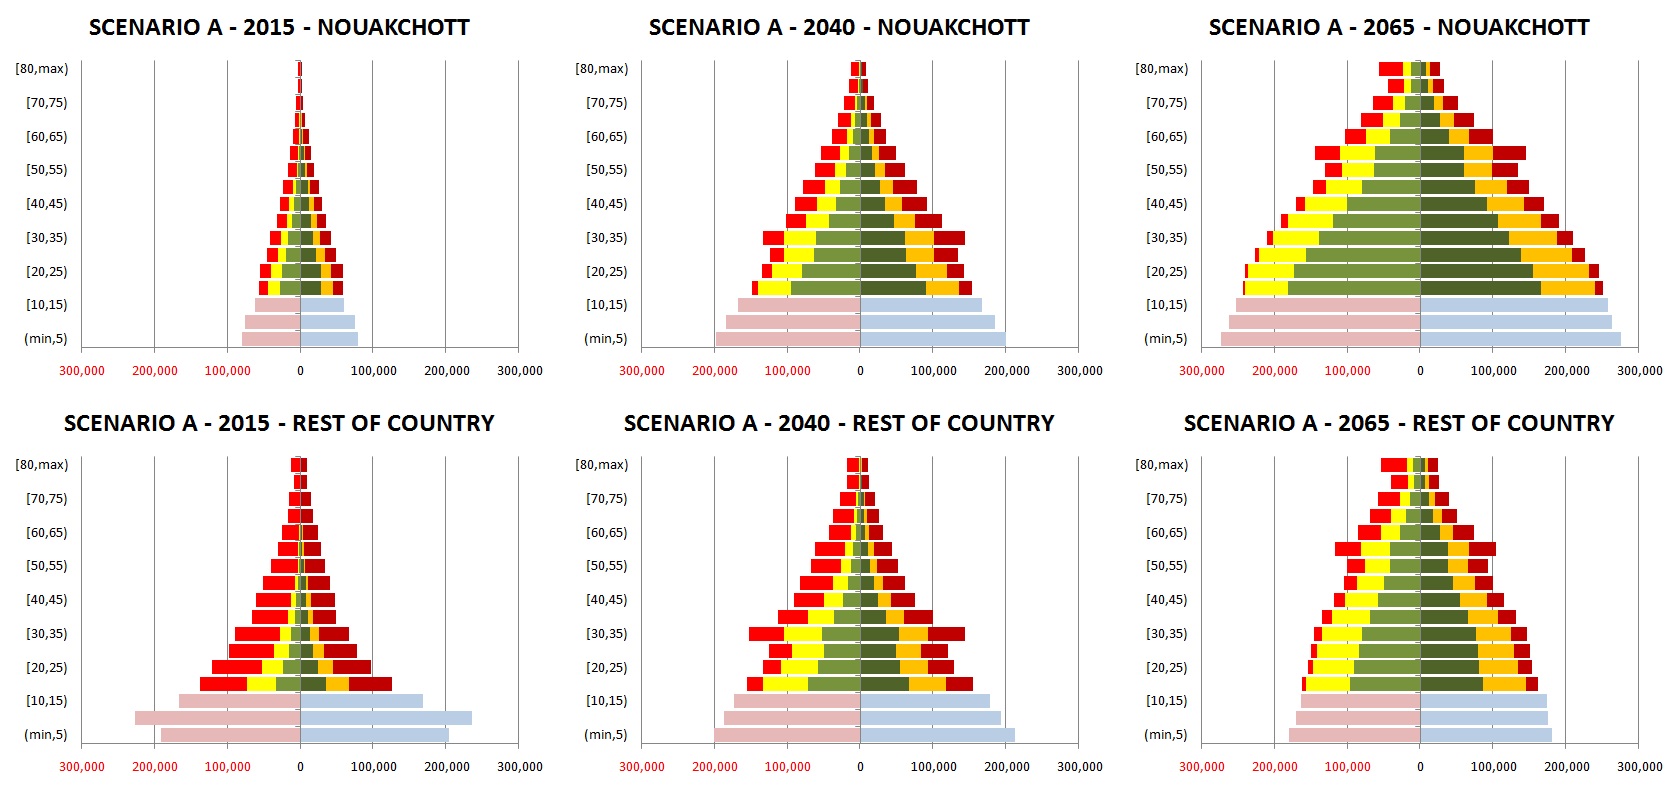
Figure 4-13: Projected Population in Scenario A. Legend: left female, right male; green: primary graduates, orange/yellow: primary dropouts, red: never entered primary.
Scenario B: Universal Primary Education, Base Migration (Without Education)
In a scenario of universal primary education attained by all birth cohorts 2010 and later, demographic effects are relatively small until 2040. As women of reproductive age are increasingly dominated by primary graduates, however, birth rates drop, and in Nouakchott and the rest of the country, the age pyramids start transforming into “columns” with very similar cohort sizes.
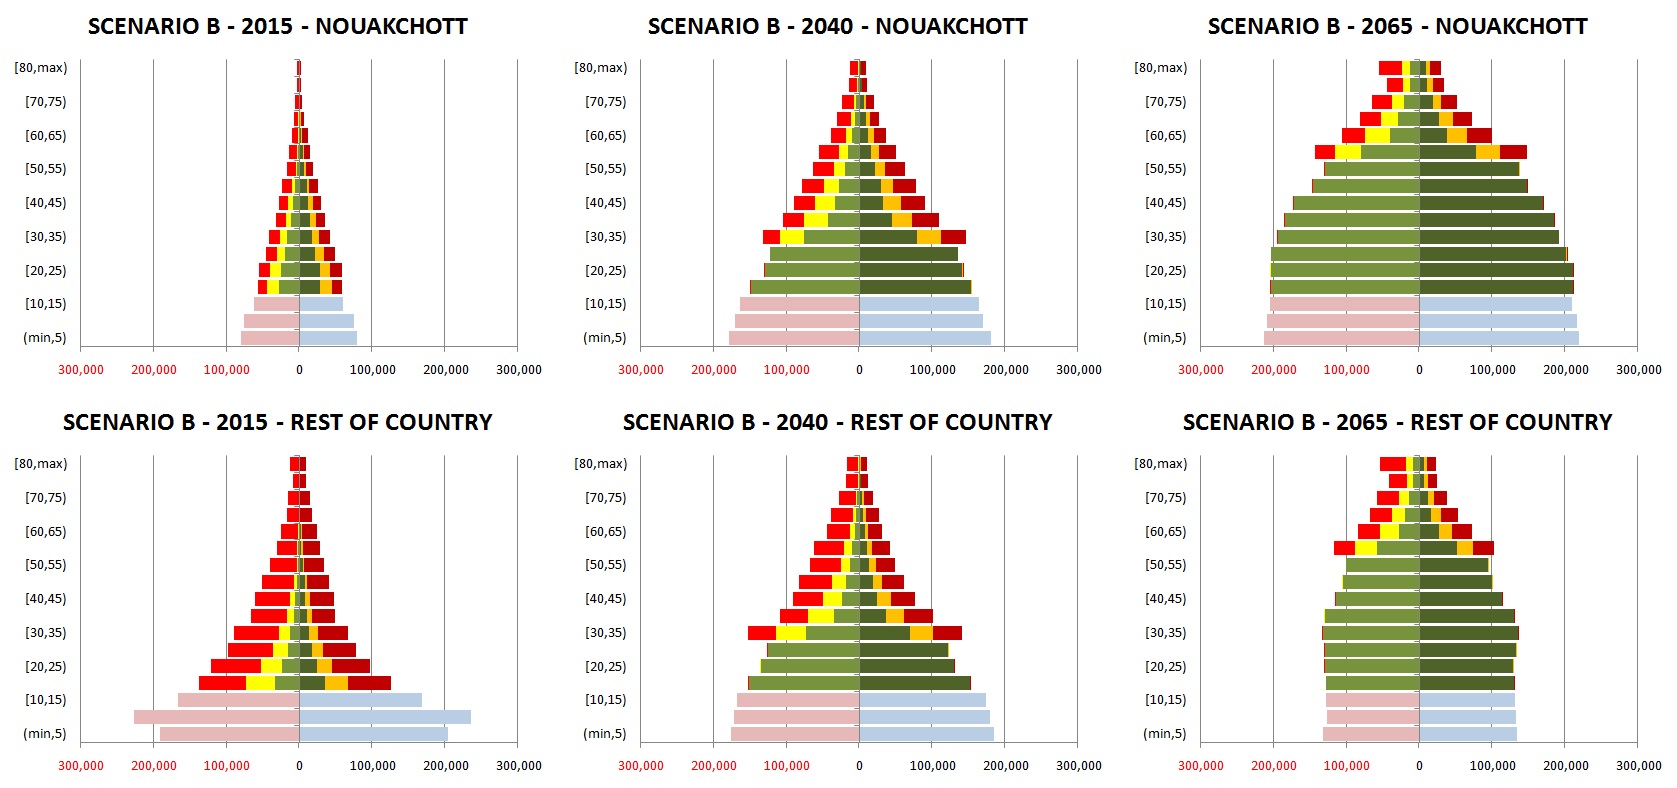
Figure 4-14: Projected Population in Scenario B. Legend: left female, right male; green: primary graduates, orange/yellow: primary dropouts, red: never entered primary.
Scenario C: Continuing Educational Trends, Refined Migration (With Education)
In this scenario, we use the refined migration module, which accounts for education in migration rates. As we observe higher migration rates for more highly educated people, Nouakchott grows even faster than in the base scenario. In contrast to the base scenario, the education composition of the capital’s population comes closer to the scenario without migration andthe more favorable education composition is kept, as the in-migrants now do not differ significantly in education composition from the native population.
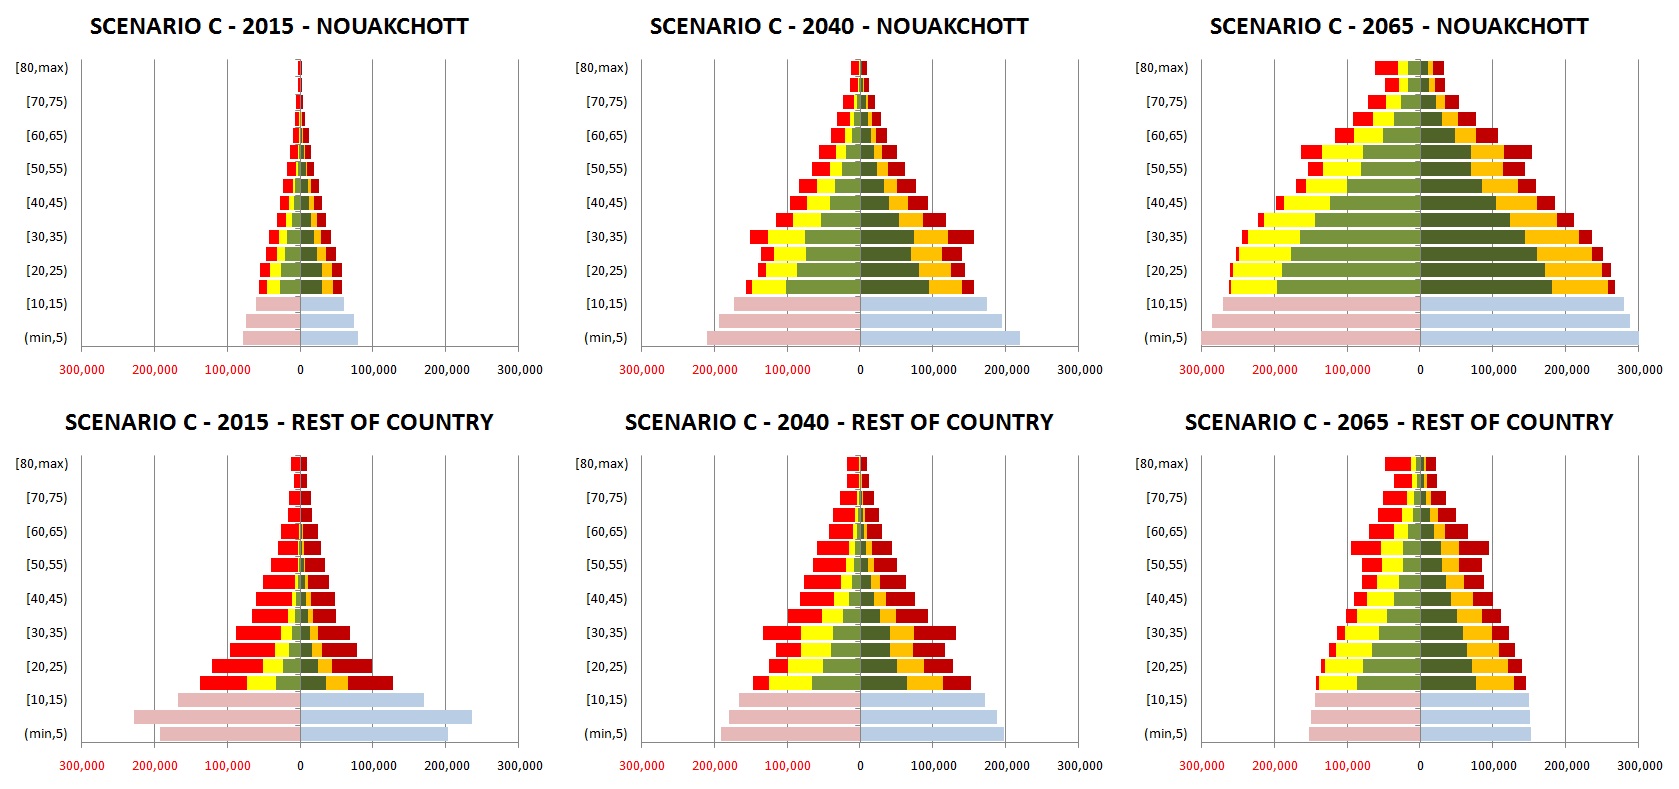
Figure : Projected Population in Scenario C. Legend: left female, right male; green: primary graduates, orange/yellow: primary dropouts, red: never entered primary.
Scenario D: Universal Primary Education, Refined Migration (With Education)
When the refined migration module is combined with a scenario of universal primary education, it erases the educational differences between Nouakchott and the rest of the country, as eventually all graduate from primary school. While migration rates and the migration-driven growth in the capital increase, birth rates drop, which leaves the total population of the capital almost unaffected, while increasing its average age. In contrast, population in the rest of the country shrinks, and those born after 2010 are more likely to migrate to the capital, due to their universal primary education. Both high migration and universal primary education make the population over-proportionally subject to population aging—very much in contrast to the initial scenario without migration.
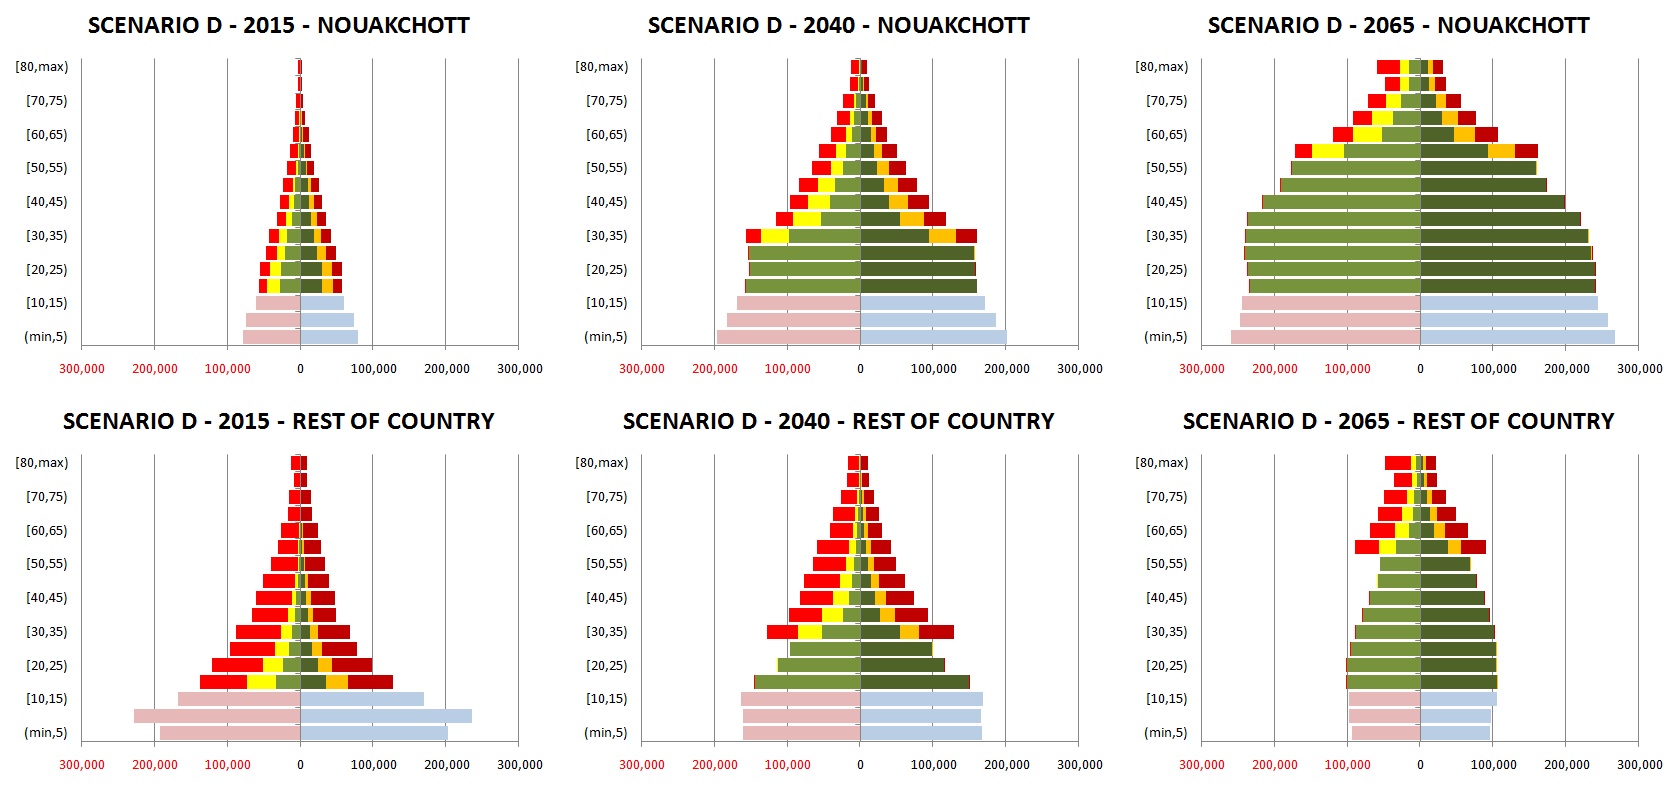
Figure 4-16: Projected Population in Scenario D. Legend: left female, right male; green: primary graduates, orange/yellow: primary dropouts, red: never entered primary.